推荐系统算法
k近邻算法
0.引入依赖
import numpy as np
import pandas as pd

# 这里直接引入sklearn里的数据集,iris鸢尾花
from sklearn.datasets import load_iris
from sklearn.model_selection import train_test_split  # 切分数据集为训练集和测试集
from sklearn.metrics import accuracy_score # 计算分类预测的准确率
1. 数据加载和预处理
iris = load_iris()
iris
iris实体数据集中包含的数据结构如下:
{'data': array([[5.1, 3.5, 1.4, 0.2],
        [4.9, 3. , 1.4, 0.2],#一个四维的样本点
        [4.7, 3.2, 1.3, 0.2],
        [4.6, 3.1, 1.5, 0.2],
        [5. , 3.6, 1.4, 0.2],
        [5.4, 3.9, 1.7, 0.4],
        [4.6, 3.4, 1.4, 0.3],
        [5. , 3.4, 1.5, 0.2],
        [4.4, 2.9, 1.4, 0.2],
        [4.9, 3.1, 1.5, 0.1],
        [5.4, 3.7, 1.5, 0.2],
        [4.8, 3.4, 1.6, 0.2],
        [4.8, 3. , 1.4, 0.1],
        [4.3, 3. , 1.1, 0.1],
        [5.8, 4. , 1.2, 0.2],
        [5.7, 4.4, 1.5, 0.4],
        [5.4, 3.9, 1.3, 0.4],
        [5.1, 3.5, 1.4, 0.3],
        [5.7, 3.8, 1.7, 0.3],
        [5.1, 3.8, 1.5, 0.3],
        [5.4, 3.4, 1.7, 0.2],
        [5.1, 3.7, 1.5, 0.4],
        [4.6, 3.6, 1. , 0.2],
        [5.1, 3.3, 1.7, 0.5],
        [4.8, 3.4, 1.9, 0.2],
        [5. , 3. , 1.6, 0.2],
        [5. , 3.4, 1.6, 0.4],
        [5.2, 3.5, 1.5, 0.2],
        [5.2, 3.4, 1.4, 0.2],
        [4.7, 3.2, 1.6, 0.2],
        [4.8, 3.1, 1.6, 0.2],
        [5.4, 3.4, 1.5, 0.4],
        [5.2, 4.1, 1.5, 0.1],
        [5.5, 4.2, 1.4, 0.2],
        [4.9, 3.1, 1.5, 0.2],
        [5. , 3.2, 1.2, 0.2],
        [5.5, 3.5, 1.3, 0.2],
        [4.9, 3.6, 1.4, 0.1],
        [4.4, 3. , 1.3, 0.2],
        [5.1, 3.4, 1.5, 0.2],
        [5. , 3.5, 1.3, 0.3],
        [4.5, 2.3, 1.3, 0.3],
        [4.4, 3.2, 1.3, 0.2],
        [5. , 3.5, 1.6, 0.6],
        [5.1, 3.8, 1.9, 0.4],
        [4.8, 3. , 1.4, 0.3],
        [5.1, 3.8, 1.6, 0.2],
        [4.6, 3.2, 1.4, 0.2],
        [5.3, 3.7, 1.5, 0.2],
        [5. , 3.3, 1.4, 0.2],
        [7. , 3.2, 4.7, 1.4],
        [6.4, 3.2, 4.5, 1.5],
        [6.9, 3.1, 4.9, 1.5],
        [5.5, 2.3, 4. , 1.3],
        [6.5, 2.8, 4.6, 1.5],
        [5.7, 2.8, 4.5, 1.3],
        [6.3, 3.3, 4.7, 1.6],
        [4.9, 2.4, 3.3, 1. ],
        [6.6, 2.9, 4.6, 1.3],
        [5.2, 2.7, 3.9, 1.4],
        [5. , 2. , 3.5, 1. ],
        [5.9, 3. , 4.2, 1.5],
        [6. , 2.2, 4. , 1. ],
        [6.1, 2.9, 4.7, 1.4],
        [5.6, 2.9, 3.6, 1.3],
        [6.7, 3.1, 4.4, 1.4],
        [5.6, 3. , 4.5, 1.5],
        [5.8, 2.7, 4.1, 1. ],
        [6.2, 2.2, 4.5, 1.5],
        [5.6, 2.5, 3.9, 1.1],
        [5.9, 3.2, 4.8, 1.8],
        [6.1, 2.8, 4. , 1.3],
        [6.3, 2.5, 4.9, 1.5],
        [6.1, 2.8, 4.7, 1.2],
        [6.4, 2.9, 4.3, 1.3],
        [6.6, 3. , 4.4, 1.4],
        [6.8, 2.8, 4.8, 1.4],
        [6.7, 3. , 5. , 1.7],
        [6. , 2.9, 4.5, 1.5],
        [5.7, 2.6, 3.5, 1. ],
        [5.5, 2.4, 3.8, 1.1],
        [5.5, 2.4, 3.7, 1. ],
        [5.8, 2.7, 3.9, 1.2],
        [6. , 2.7, 5.1, 1.6],
        [5.4, 3. , 4.5, 1.5],
        [6. , 3.4, 4.5, 1.6],
        [6.7, 3.1, 4.7, 1.5],
        [6.3, 2.3, 4.4, 1.3],
        [5.6, 3. , 4.1, 1.3],
        [5.5, 2.5, 4. , 1.3],
        [5.5, 2.6, 4.4, 1.2],
        [6.1, 3. , 4.6, 1.4],
        [5.8, 2.6, 4. , 1.2],
        [5. , 2.3, 3.3, 1. ],
        [5.6, 2.7, 4.2, 1.3],
        [5.7, 3. , 4.2, 1.2],
        [5.7, 2.9, 4.2, 1.3],
        [6.2, 2.9, 4.3, 1.3],
        [5.1, 2.5, 3. , 1.1],
        [5.7, 2.8, 4.1, 1.3],
        [6.3, 3.3, 6. , 2.5],
        [5.8, 2.7, 5.1, 1.9],
        [7.1, 3. , 5.9, 2.1],
        [6.3, 2.9, 5.6, 1.8],
        [6.5, 3. , 5.8, 2.2],
        [7.6, 3. , 6.6, 2.1],
        [4.9, 2.5, 4.5, 1.7],
        [7.3, 2.9, 6.3, 1.8],
        [6.7, 2.5, 5.8, 1.8],
        [7.2, 3.6, 6.1, 2.5],
        [6.5, 3.2, 5.1, 2. ],
        [6.4, 2.7, 5.3, 1.9],
        [6.8, 3. , 5.5, 2.1],
        [5.7, 2.5, 5. , 2. ],
        [5.8, 2.8, 5.1, 2.4],
        [6.4, 3.2, 5.3, 2.3],
        [6.5, 3. , 5.5, 1.8],
        [7.7, 3.8, 6.7, 2.2],
        [7.7, 2.6, 6.9, 2.3],
        [6. , 2.2, 5. , 1.5],
        [6.9, 3.2, 5.7, 2.3],
        [5.6, 2.8, 4.9, 2. ],
        [7.7, 2.8, 6.7, 2. ],
        [6.3, 2.7, 4.9, 1.8],
        [6.7, 3.3, 5.7, 2.1],
        [7.2, 3.2, 6. , 1.8],
        [6.2, 2.8, 4.8, 1.8],
        [6.1, 3. , 4.9, 1.8],
        [6.4, 2.8, 5.6, 2.1],
        [7.2, 3. , 5.8, 1.6],
        [7.4, 2.8, 6.1, 1.9],
        [7.9, 3.8, 6.4, 2. ],
        [6.4, 2.8, 5.6, 2.2],
        [6.3, 2.8, 5.1, 1.5],
        [6.1, 2.6, 5.6, 1.4],
        [7.7, 3. , 6.1, 2.3],
        [6.3, 3.4, 5.6, 2.4],
        [6.4, 3.1, 5.5, 1.8],
        [6. , 3. , 4.8, 1.8],
        [6.9, 3.1, 5.4, 2.1],
        [6.7, 3.1, 5.6, 2.4],
        [6.9, 3.1, 5.1, 2.3],
        [5.8, 2.7, 5.1, 1.9],
        [6.8, 3.2, 5.9, 2.3],
        [6.7, 3.3, 5.7, 2.5],
        [6.7, 3. , 5.2, 2.3],
        [6.3, 2.5, 5. , 1.9],
        [6.5, 3. , 5.2, 2. ],
        [6.2, 3.4, 5.4, 2.3],
        [5.9, 3. , 5.1, 1.8]]),
 'target': array([0, 0, 0, 0, 0, 0, 0, 0, 0, 0, 0, 0, 0, 0, 0, 0, 0, 0, 0, 0, 0, 0,
        0, 0, 0, 0, 0, 0, 0, 0, 0, 0, 0, 0, 0, 0, 0, 0, 0, 0, 0, 0, 0, 0,
        0, 0, 0, 0, 0, 0, 1, 1, 1, 1, 1, 1, 1, 1, 1, 1, 1, 1, 1, 1, 1, 1,
        1, 1, 1, 1, 1, 1, 1, 1, 1, 1, 1, 1, 1, 1, 1, 1, 1, 1, 1, 1, 1, 1,
        1, 1, 1, 1, 1, 1, 1, 1, 1, 1, 1, 1, 2, 2, 2, 2, 2, 2, 2, 2, 2, 2,
        2, 2, 2, 2, 2, 2, 2, 2, 2, 2, 2, 2, 2, 2, 2, 2, 2, 2, 2, 2, 2, 2,
        2, 2, 2, 2, 2, 2, 2, 2, 2, 2, 2, 2, 2, 2, 2, 2, 2, 2]),#等级分类
 'frame': None,
 'target_names': array(['setosa', 'versicolor', 'virginica'], dtype='<U10'),#分类名称
 'DESCR': '.. _iris_dataset:\n\nIris plants dataset\n--------------------\n\n**Data Set Characteristics:**\n\n    :Number of Instances: 150 (50 in each of three classes)\n    :Number of Attributes: 4 numeric, predictive attributes and the class\n    :Attribute Information:\n        - sepal length in cm\n        - sepal width in cm\n        - petal length in cm\n        - petal width in cm\n        - class:\n                - Iris-Setosa\n                - Iris-Versicolour\n                - Iris-Virginica\n                \n    :Summary Statistics:\n\n    ============== ==== ==== ======= ===== ====================\n                    Min  Max   Mean    SD   Class Correlation\n    ============== ==== ==== ======= ===== ====================\n    sepal length:   4.3  7.9   5.84   0.83    0.7826\n    sepal width:    2.0  4.4   3.05   0.43   -0.4194\n    petal length:   1.0  6.9   3.76   1.76    0.9490  (high!)\n    petal width:    0.1  2.5   1.20   0.76    0.9565  (high!)\n    ============== ==== ==== ======= ===== ====================\n\n    :Missing Attribute Values: None\n    :Class Distribution: 33.3% for each of 3 classes.\n    :Creator: R.A. Fisher\n    :Donor: Michael Marshall (MARSHALL%PLU@io.arc.nasa.gov)\n    :Date: July, 1988\n\nThe famous Iris database, first used by Sir R.A. Fisher. The dataset is taken\nfrom Fisher\'s paper. Note that it\'s the same as in R, but not as in the UCI\nMachine Learning Repository, which has two wrong data points.\n\nThis is perhaps the best known database to be found in the\npattern recognition literature.  Fisher\'s paper is a classic in the field and\nis referenced frequently to this day.  (See Duda & Hart, for example.)  The\ndata set contains 3 classes of 50 instances each, where each class refers to a\ntype of iris plant.  One class is linearly separable from the other 2; the\nlatter are NOT linearly separable from each other.\n\n.. topic:: References\n\n   - Fisher, R.A. "The use of multiple measurements in taxonomic problems"\n     Annual Eugenics, 7, Part II, 179-188 (1936); also in "Contributions to\n     Mathematical Statistics" (John Wiley, NY, 1950).\n   - Duda, R.O., & Hart, P.E. (1973) Pattern Classification and Scene Analysis.\n     (Q327.D83) John Wiley & Sons.  ISBN 0-471-22361-1.  See page 218.\n   - Dasarathy, B.V. (1980) "Nosing Around the Neighborhood: A New System\n     Structure and Classification Rule for Recognition in Partially Exposed\n     Environments".  IEEE Transactions on Pattern Analysis and Machine\n     Intelligence, Vol. PAMI-2, No. 1, 67-71.\n   - Gates, G.W. (1972) "The Reduced Nearest Neighbor Rule".  IEEE Transactions\n     on Information Theory, May 1972, 431-433.\n   - See also: 1988 MLC Proceedings, 54-64.  Cheeseman et al"s AUTOCLASS II\n     conceptual clustering system finds 3 classes in the data.\n   - Many, many more ...',#说明内容
 'feature_names': ['sepal length (cm)',
  'sepal width (cm)',
  'petal length (cm)',
  'petal width (cm)'],#特征名称,与data对应
 'filename': 'E:\\Anaconda\\lib\\site-packages\\sklearn\\datasets\\data\\iris.csv'}
df = pd.DataFrame(data = iris.data, columns = iris.feature_names)
df['class'] = iris.target#新增class列
df['class'] = df['class'].map({0: iris.target_names[0], 1: iris.target_names[1], 2: iris.target_names[2]})#添加特征名称
df.head(10)
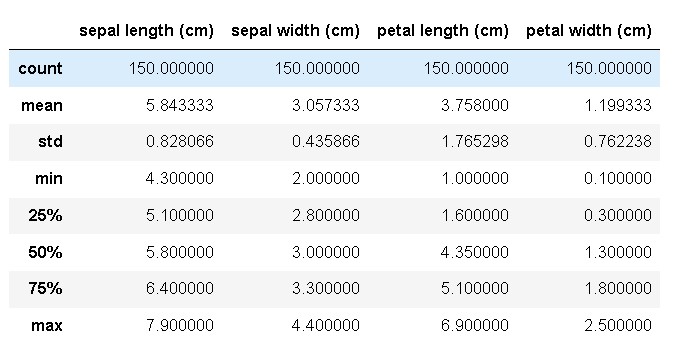
df.describe()

x = iris.data
y = iris.target.reshape(-1,1)#任意行一列的列向量
print(x.shape, y.shape)
(150, 4) (150, 1)
划分训练集和测试集:
x_train, x_test, y_train, y_test = train_test_split(x, y, test_size=0.3, random_state=35, stratify=y)#stratify根据y进行等比例分成
print(x_train.shape, y_train.shape)
print(x_test.shape, y_test.shape)
(105, 4) (105, 1)
(45, 4) (45, 1)
a = np.array([[3,2,4,2],
             [2,1,4,23],
             [12,3,2,3],
             [2,3,15,23],
             [1,3,2,3],
             [13,3,2,2],
             [213,16,3,63],
             [23,62,23,23],
             [23,16,23,43]])
b = np.array([[1,1,1,1]])
print(a-b)
np.sum(np.abs(a - b), axis=1)
dist = np.sqrt( np.sum((a-b) ** 2, axis=1) )
print(dist)
[[ 2 1 3 1]
[ 1 0 3 22]
[ 11 2 1 2]
[ 1 2 14 22]
[ 0 2 1 2]
[ 12 2 1 1]
[212 15 2 62]
[ 22 61 22 22]
[ 22 15 22 42]]
[ 3.87298335 22.22611077 11.40175425 26.17250466 3.
12.24744871 221.39783197 71.92357055 54.3783045 ]
2. 核心算法实现
# 距离函数定义
def l1_distance(a, b):#l1_distance为曼哈顿距离
    return np.sum(np.abs(a-b), axis=1)#a为矩阵,b为向量,1为列
def l2_distance(a, b):#l2_distance为欧式距离
    return np.sqrt( np.sum((a-b) ** 2, axis=1) )
# 分类器实现
class kNN(object):
    # 定义一个初始化方法,__init__ 是类的构造方法
    def __init__(self, n_neighbors = 1, dist_func = l1_distance):
        self.n_neighbors = n_neighbors
        self.dist_func = dist_func

    # 训练模型方法
    def fit(self, x, y):
        self.x_train = x
        self.y_train = y

    # 模型预测方法
    def predict(self, x):
        # 初始化预测分类数组
        y_pred = np.zeros( (x.shape[0], 1), dtype=self.y_train.dtype )
        #zeros((行,列),dtype=数据类型)
        # 遍历输入的x数据点,取出每一个数据点的序号i和数据x_test
        for i, x_test in enumerate(x):#enumerate为枚举方法
            # x_test跟所有训练数据计算距离
            distances = self.dist_func(self.x_train, x_test)

            # 得到的距离按照由近到远排序,取出索引值
            nn_index = np.argsort(distances)#按照数据的索引值由小到大进行排序

            # 选取最近的k个点,保存它们对应的分类类别
            nn_y = self.y_train[ nn_index[:self.n_neighbors] ].ravel()#ravel:转换为一维数组

            # 统计类别中出现频率最高的那个,赋给y_pred[i]
            y_pred[i] = np.argmax( np.bincount(nn_y) )#bincount:索引值出现的个数

        return y_pred

nn_index = np.argsort(dist)
print("dist: ",dist)
print("nn_index: ",nn_index)
nn_y = y_train[ nn_index[:9] ].ravel()
#print(y_train[:8])
print("nn_y: ",nn_y)
print(np.bincount(nn_y))
print(np.argmax(np.bincount(nn_y)))
dist: [ 3.87298335 22.22611077 11.40175425 26.17250466 3.
12.24744871 221.39783197 71.92357055 54.3783045 ]
nn_index: [4 0 2 5 1 3 8 7 6]
nn_y: [1 1 2 1 2 2 0 0 1]
[2 4 3]
1
3. 测试
# 定义一个knn实例
knn = kNN(n_neighbors = 3)
# 训练模型
knn.fit(x_train, y_train)
# 传入测试数据,做预测
y_pred = knn.predict(x_test)

print(y_test.ravel())
print(y_pred.ravel())
# 求出预测准确率
accuracy = accuracy_score(y_test, y_pred)

print("预测准确率: ", accuracy)
[2 1 2 2 0 0 2 0 1 1 2 0 1 1 1 2 2 0 1 2 1 0 0 0 1 2 0 2 0 0 2 1 0 2 1 0 2
1 2 2 1 1 1 0 0]
[2 1 2 2 0 0 2 0 1 1 1 0 1 1 1 2 2 0 1 2 1 0 0 0 1 2 0 2 0 0 2 1 0 2 1 0 2
1 2 1 1 2 1 0 0]
预测准确率: 0.9333333333333333
# 定义一个knn实例
knn = kNN()
# 训练模型
knn.fit(x_train, y_train)

# 保存结果list
result_list = []

# 针对不同的参数选取,做预测
for p in [1, 2]:
    knn.dist_func = l1_distance if p == 1 else l2_distance

    # 考虑不同的k取值,步长为2
    for k in range(1, 10, 2):
        knn.n_neighbors = k
        # 传入测试数据,做预测
        y_pred = knn.predict(x_test)
        # 求出预测准确率
        accuracy = accuracy_score(y_test, y_pred)
        result_list.append([k, 'l1_distance' if p == 1 else 'l2_distance', accuracy])
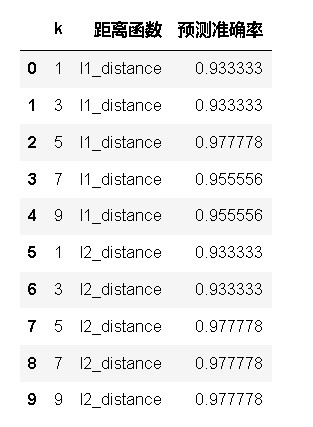
df = pd.DataFrame(result_list, columns=['k', '距离函数', '预测准确率'])
df

k means(k均值聚类)
0. 引入依赖
import numpy as np
import matplotlib.pyplot as plt

# 从sklearn中直接生成聚类数据
from sklearn.datasets.samples_generator import make_blobs
1. 数据加载
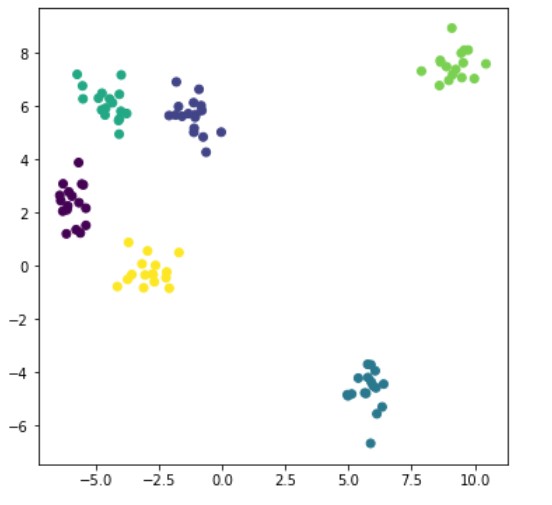
x, y = make_blobs( n_samples=100, centers=6, random_state=1234, cluster_std=0.6 )#n_samples为样本点,centers为中心点,random_state为随机状态,cluster_std为聚类标准差

plt.figure(figsize=(6,6))#画布
plt.scatter(x[:,0], x[:,1], c=y)
plt.show()

2. 算法实现
# 引入scipy中的距离函数,默认欧式距离
from scipy.spatial.distance import cdist

class K_Means(object):
    # 初始化,参数 n_clusters(K)、迭代次数max_iter、初始质心 centroids
    def __init__(self, n_clusters=5, max_iter=300, centroids=[]):
        self.n_clusters = n_clusters
        self.max_iter = max_iter
        self.centroids = np.array( centroids, dtype=np.float )
    # 训练模型方法,k-means聚类过程,传入原始数据
    def fit(self, data):
        # 假如没有指定初始质心,就随机选取data中的点作为初始质心
        if( self.centroids.shape == (0,) ):
            # 从data中随机生成0到data行数的6个整数,作为索引值
            self.centroids = data[ np.random.randint( 0, data.shape[0], self.n_clusters ) ,: ]

        # 开始迭代
        for i in range(self.max_iter):
            # 1. 计算距离矩阵,得到的是一个100*6的矩阵
            distances = cdist(data, self.centroids)

            # 2. 对距离按有近到远排序,选取最近的质心点的类别,作为当前点的分类
            c_ind = np.argmin( distances, axis=1 )

            # 3. 对每一类数据进行均值计算,更新质心点坐标
            for i in range(self.n_clusters):#i取0,1,2,3,4,5
                # 排除掉没有出现在c_ind里的类别
                if i in c_ind:
                    # 选出所有类别是i的点,取data里面坐标的均值,更新第i个质心
                    self.centroids[i] = np.mean( data[c_ind==i], axis=0 )

    # 实现预测方法
    def predict(self, samples):
        # 跟上面一样,先计算距离矩阵,然后选取距离最近的那个质心的类别
        distances = cdist(samples, self.centroids)
        c_ind = np.argmin( distances, axis=1 )

        return c_ind

dist = np.array([[121,221,32,43],
                [121,1,12,23],
                [65,21,2,43],
                [1,221,32,43],
                [21,11,22,3],])#二维数组,几行就有几个样本点,列代表距离大小
c_ind = np.argmin( dist, axis=1 )
print(c_ind)
x_new=x[0:5]
print(x_new)
print(c_ind==2)
print(x_new[c_ind==2])
np.mean(x_new[c_ind==2], axis=0)
[2 1 2 0 3]
[[-0.02708305 5.0215929 ]
[-5.49252256 6.27366991]
[-5.37691608 1.51403209]
[-5.37872006 2.16059225]
[ 9.58333171 8.10916554]]
[ True False True False False]
[[-0.02708305 5.0215929 ]
[-5.37691608 1.51403209]]
array([-2.70199956, 3.26781249])
3. 测试
# 定义一个绘制子图函数
def plotKMeans(x, y, centroids, subplot, title):
    # 分配子图
    plt.subplot(subplot)
    plt.scatter(x[:,0], x[:,1], c='r')
    # 画出质心点
    plt.scatter(centroids[:,0], centroids[:,1], c=np.array(range(5)), s=100)#c代表color,s代表size
    plt.title(title)

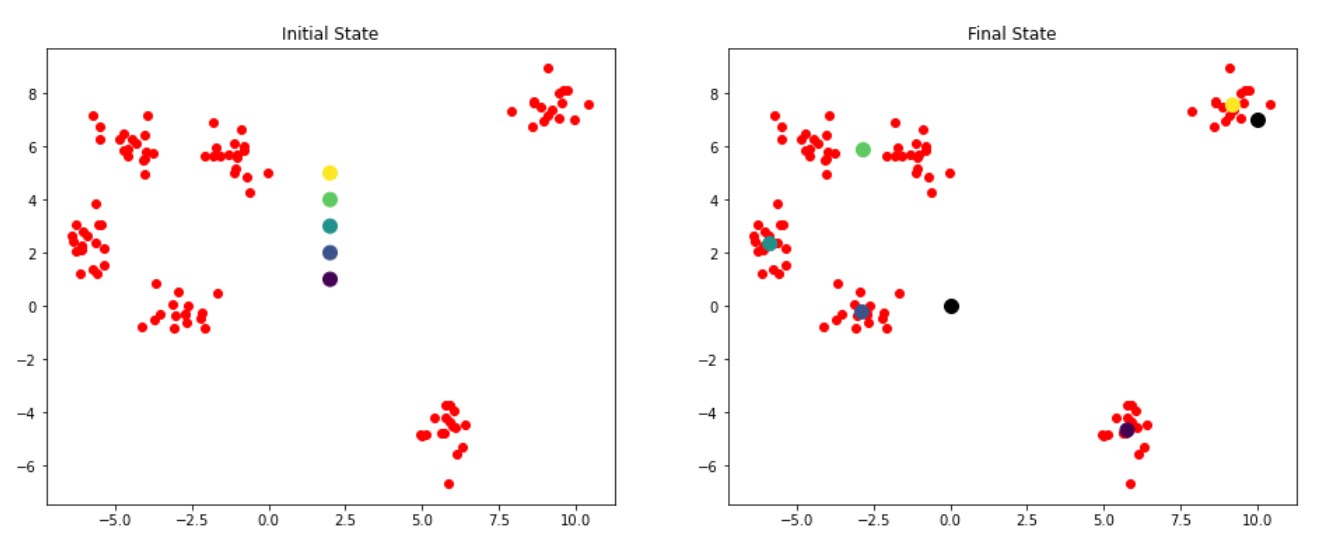
kmeans = K_Means(max_iter=300, centroids=np.array([[2,1],[2,2],[2,3],[2,4],[2,5]]))

plt.figure(figsize=(16, 6))
plotKMeans( x, y, kmeans.centroids, 121, 'Initial State' )#121表示1行2列的子图中的第一个

# 开始聚类
kmeans.fit(x)

plotKMeans( x, y, kmeans.centroids, 122, 'Final State' )#121表示1行2列的子图中的第二个

# 预测新数据点的类别
x_new = np.array([[0,0],[10,7]])
y_pred = kmeans.predict(x_new)

print(kmeans.centroids)
print(y_pred)

plt.scatter(x_new[:,0], x_new[:,1], s=100, c='black')
[[ 5.76444812 -4.67941789]
[-2.89174024 -0.22808556]
[-5.89115978 2.33887408]
[-2.8455246 5.87376915]
[ 9.20551979 7.56124841]]
[1 4]
<matplotlib.collections.PathCollection at 0x13acb34ee80>

TF-IDF算法(Term Frequency-Inverse Document Frequency)
0. 引入依赖
import numpy as np
import pandas as pd
1. 定义数据和预处理
docA = "The cat sat on my bed"
docB = "The girl tune on my brain"

bowA = docA.split(" ")
bowB = docB.split(" ")
bowA

# 构建词库
wordSet = set(bowA).union(set(bowB))
wordSet
{‘The’, ‘brain’, ‘cat’, ‘girl’, ‘hand’, ‘my’, ‘on’, ‘sat’, ‘tune’}
2. 进行词数统计
# 用统计字典来保存词出现的次数
wordDictA = dict.fromkeys( wordSet, 0 )
wordDictB = dict.fromkeys( wordSet, 0 )

# 遍历文档,统计词数
for word in bowA:
    wordDictA[word] += 1
for word in bowB:
    wordDictB[word] += 1

pd.DataFrame([wordDictA, wordDictB])

3. 计算词频TF
def computeTF( wordDict, bow ):
    # 用一个字典对象记录tf,把所有的词对应在bow文档里的tf都算出来
    tfDict = {}
    nbowCount = len(bow)

    for word, count in wordDict.items():
        tfDict[word] = count / nbowCount
    return tfDict

tfA = computeTF( wordDictA, bowA )
tfB = computeTF( wordDictB, bowB )
tfA
{‘on’: 0.16666666666666666,
‘my’: 0.16666666666666666,
‘cat’: 0.16666666666666666,
‘girl’: 0.0,
‘The’: 0.16666666666666666,
‘tune’: 0.0,
‘brain’: 0.0,
‘sat’: 0.16666666666666666,
‘hand’: 0.16666666666666666}
4. 计算逆文档频率idf
def computeIDF( wordDictList ):
    # 用一个字典对象保存idf结果,每个词作为key,初始值为0
    idfDict = dict.fromkeys(wordDictList[0], 0)
    N = len(wordDictList)
    import math

    for wordDict in wordDictList:
        # 遍历字典中的每个词汇,统计Ni
        for word, count in wordDict.items():
            if count > 0:
                # 先把Ni增加1,存入到idfDict
                idfDict[word] += 1

    # 已经得到所有词汇i对应的Ni,现在根据公式把它替换成为idf值
    for word, ni in idfDict.items():
        idfDict[word] = math.log10( (N+1)/(ni+1) )

    return idfDict

idfs = computeIDF( [wordDictA, wordDictB] )
idfs
{‘on’: 0.0,
‘my’: 0.0,
‘cat’: 0.17609125905568124,
‘girl’: 0.17609125905568124,
‘The’: 0.0,
‘tune’: 0.17609125905568124,
‘brain’: 0.17609125905568124,
‘sat’: 0.17609125905568124,
‘hand’: 0.17609125905568124}
5. 计算TF-IDF
def computeTFIDF( tf, idfs ):
    tfidf = {}
    for word, tfval in tf.items():
        tfidf[word] = tfval * idfs[word]
    return tfidf

tfidfA = computeTFIDF( tfA, idfs )
tfidfB = computeTFIDF( tfB, idfs )
pd.DataFrame( [tfidfA, tfidfB] )

得出结论,在第一句子中,cat,sat,hand是关键词
在第一句子中,girl,tune,brain是关键词
LFM(隐语义模型)梯度下降算法
0. 引入依赖
import numpy as np
import pandas as pd
1. 数据准备
# 评分矩阵R
R = np.array([[4,0,2,0,1],
             [0,2,3,0,0],
             [1,0,2,4,0],
             [5,0,0,3,1],
             [0,0,1,5,1],
             [0,3,2,4,1],])
len(R[0])#第一行的列数
5
2. 算法实现
"""
@输入参数:
R:M*N 的评分矩阵
K:隐特征向量维度
max_iter: 最大迭代次数
alpha:步长
lamda:正则化系数

@输出:
分解之后的 P,Q
P:初始化用户特征矩阵M*K
Q:初始化物品特征矩阵N*K
"""

# 给定超参数

K = 5
max_iter = 5000
alpha = 0.0002
lamda = 0.004

# 核心算法
def LFM_grad_desc( R, K=2, max_iter=1000, alpha=0.0001, lamda=0.002 ):
    # 基本维度参数定义
    M = len(R)#行数,用户u的个数
    N = len(R[0])#列数,物品i的个数

    # P,Q初始值,随机生成
    P = np.random.rand(M, K)
    Q = np.random.rand(N, K)
    Q = Q.T

    # 开始迭代
    for step in range(max_iter):
        # 对所有的用户u、物品i做遍历,对应的特征向量Pu、Qi梯度下降
        for u in range(M):
            for i in range(N):
                # R[u][i]为,对于每一个大于0的评分,求出预测评分误差
                if R[u][i] > 0:
                    eui = np.dot( P[u,:], Q[:,i] ) - R[u][i]

                    # 代入公式,按照梯度下降算法更新当前的Pu、Qi
                    for k in range(K):
                        P[u][k] = P[u][k] - alpha * ( 2 * eui * Q[k][i] + 2 * lamda * P[u][k] )
                        Q[k][i] = Q[k][i] - alpha * ( 2 * eui * P[u][k] + 2 * lamda * Q[k][i] )

        # u、i遍历完成,所有特征向量更新完成,可以得到P、Q,可以计算预测评分矩阵
        predR = np.dot( P, Q )

        # 计算当前损失函数
        cost = 0
        for u in range(M):
            for i in range(N):
                if R[u][i] > 0:
                    cost += ( np.dot( P[u,:], Q[:,i] ) - R[u][i] ) ** 2
                    # 加上正则化项
                    for k in range(K):
                        cost += lamda * ( P[u][k] ** 2 + Q[k][i] ** 2 )
        if cost < 0.0001:
            break

    return P, Q.T, cost
3. 测试
P, Q, cost = LFM_grad_desc(R, K, max_iter, alpha, lamda)
#P:初始化用户特征矩阵M*K
#Q:初始化物品特征矩阵N*K
print(P)
print(Q)
print(cost)

predR = P.dot(Q.T)#预测评分

print(R)
predR
[[ 0.32334569 0.67835992 0.59868775 1.11291435 0.68009067]
[ 0.65697936 0.82597662 0.74628252 1.23966017 -0.10077335]
[ 1.58771558 -0.33372148 0.70249208 0.09361912 0.73866161]
[-0.04919744 0.78293268 1.31877972 1.19791609 0.59195065]
[ 0.74677141 0.8440339 0.47174473 0.22923942 1.54093343]
[ 0.99114888 0.34021746 0.60333939 0.75705538 0.8570284 ]]
[[-0.09738207 1.51006491 1.09369362 1.45823051 1.04729912]
[ 1.06820434 0.07824693 0.8745322 0.63352485 0.8580112 ]
[ 0.90206684 0.13380736 1.03890297 1.11496412 -0.34989194]
[ 1.51898357 0.73254935 0.58428731 0.52873885 1.82886301]
[ 0.10617821 0.27508527 -0.00570176 0.46643881 0.41588337]]
0.6182285635887727
[[4 0 2 0 1]
[0 2 3 0 0]
[1 0 2 4 0]
[5 0 0 3 1]
[0 0 1 5 1]
[0 3 2 4 1]]
array([[3.98280444, 2.21063487, 2.00732879, 3.1701283 , 1.01947036],
[3.70167517, 2.11795729, 2.89591258, 2.51020874, 0.82903142],
[1.01987288, 2.97733391, 1.96332251, 3.9781146 , 0.42363816],
[4.99619827, 2.42883439, 2.55898165, 2.98533441, 1.00756717],
[3.66587017, 2.7436705 , 0.99310623, 4.96762839, 1.05655712],
[3.07862509, 2.82796359, 2.11063949, 4.07496062, 0.90493099]])


